• ABOUT – DICK YOUNG
  • YWMF – ARCHIVES

Young's World Money Forecast

Since 1978 With a 32 Year Vacation

  • DICK YOUNG
    • FROM RICHARD C. YOUNG
    • THE FINAL INTELLIGENCE REPORT
  • INVESTING STRATEGIES
    • RETIREMENT COMPOUNDERS®
    • GOLD & SILVER
  • DIVIDENDS & COMPOUNDING
    • MIRACLE OF COMPOUNDING
    • DIVIDENDS
  • GRAHAM & RUSSELL
    • BEN GRAHAM
    • RICHARD RUSSELL
  • THE DOW AND THE LEADERS
    • DOW vs. S&P 500
    • DOW vs. DOW DIVIDEND PER SHARE
  • WELLINGTON MANAGEMENT COMPANY
  • YOUR SURVIVAL GUY
  • BANK CREDIT & MONEY
  • THE PRUDENT MAN

Bull and Bear Portfolio Update 10.27.2017

October 27, 2017 By Richard Young

Model Guidance: No Changes for the Week

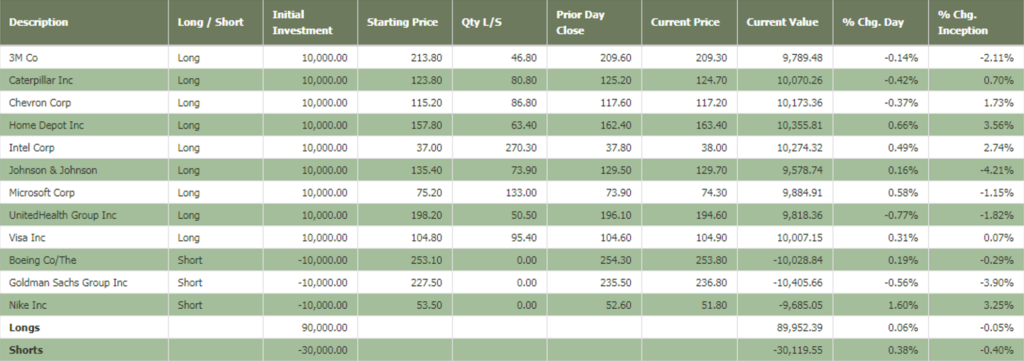
My short-term Bull & Bear Portfolio consists of 9 equally-weighted long positions and 3 equally-weighted short positions. Both the long and short stocks are selected from the Dow Jones Industrial Average. If the Dow advances over the period in which my 12-Dow stock portfolio is open, the model will make money with the stocks that advance and will lose money with the stocks that decline. And the opposite will prevail for the short stocks. Each week, I will review the model portfolio for potential changes. If no changes are required, I’ll simply post no changes for the week. You can read more about my Bull & Bear Portfolio here.

Symbol Description L / S Initial Investment Starting Price Qty L/S Prior Day Close Current Price Current Value % Chg. Day % Chg. Inception
AAPL US Apple Inc Long 10,000.00 165.70 60.34 187.00 187.00 11,283.49 0.00 12.83
CSCO US Cisco Systems Inc Long 10,000.00 44.10 226.81 43.50 43.50 9,857.11 0.00 -1.43
HD US Home Depot Inc Long 10,000.00 177.00 56.49 185.30 185.30 10,470.03 0.00 4.70
INTC US Intel Corp Long 10,000.00 51.50 194.06 54.80 54.20 10,523.97 -1.06 5.24
JPM US Jpmorgan Chase & Co Long 10,000.00 111.50 89.71 113.00 113.00 10,133.67 0.00 1.34
TRV US Travelers Cos Inc/The Long 10,000.00 136.80 73.08 130.70 130.70 9,552.76 0.00 -4.47
UNH US Unitedhealth Group Inc Long 10,000.00 235.10 42.54 243.00 243.00 10,336.08 0.00 3.36
UTX US United Technologies Corp Long 10,000.00 123.10 81.25 124.60 124.60 10,124.31 0.00 1.24
WMT US Walmart Inc Long 10,000.00 87.00 114.97 84.50 84.20 9,683.84 -0.31 -3.16
VZ US Verizon Communications Inc Long 10,000.00 47.90 208.77 47.90 47.90 9,989.56 0.00 -0.10
KO US Coca-Cola Co/The Short -8,000.00 43.70 -182.90 42.30 42.30 -7,736.63 0.00 3.40
CVX US Chevron Corp Short -8,000.00 122.30 -65.41 129.50 129.50 -8,467.66 0.00 -5.52
DWDP US Dowdupont Inc Short -8,000.00 66.04 -121.14 68.16 68.16 -8,256.81 0.00 -3.11
MRK US Merck & Co. Inc. Short -8,000.00 58.83 -135.99 59.07 59.07 -8,032.64 0.00 -0.41
IBM US Intl Business Machines Corp Short -8,000.00 144.90 -55.21 144.50 144.50 -7,977.92 0.00 0.28
Longs 100,000.00 101,955.00 -0.14 1.95
Shorts -40,000.00 -40,471.66 0.00 -1.17

Featured Analysis:

Earnings reports are coming in from the big Dow companies I have advised as long positions in my Bull & Bear portfolio. I don’t spend any time worrying about companies “beating” estimates, or achieving artificial guidance benchmarks created by management to control Wall St. analysts’ opinions. What is helpful though are the actual details about the business you may glean from an earnings report. Here are a few I’d like to share from the recent earnings season.

3M: The business with the best momentum in the last quarter at 3M was its electronics and energy business. Particularly strong was 3M’s displays unit. 3M builds multi-touch projected capacitive (PCAP) display systems that can be from 7 inches to 65 inches wide. The glass is bezel-free, for the glass-to-edge designs you see on the most advanced technologies. The PCAP systems use 3M’s proprietary Ultrafine Metal Mesh designs to get accurate responsive behavior from display screens. 3m debuted its 65”, 4k ultra-high definition display last year at a tech gathering known as InfoComm. The machine is targeted at large public venues and retail applications. 3M’s innovative technology has always kept it ahead of its peers.

Caterpillar: A highlight in Caterpillar’s last quarter was strong sales in China. After getting completely shut out of China in the 1950s and 1960s, Caterpillar returned to the Middle Kingdom in 1972, after a 23 year absence. The reopening of China’s doors to Cat employees revolved around an order for 38 pipelaying machines and replacement parts the Chinese wanted to buy. Now, years after that humble start of 38 machines, Caterpillar has sold in the first eight months of 2017 over 85,000 excavators, according to the China Construction Machinery Association. And Cat has recently unveiled its next generation of hydraulic excavators at a Beijing trade show. Sales of mini-excavators are doing so well in China that Caterpillar is planning on increasing capacity at its Chinese production facility.

Microsoft: The story this quarter at Microsoft was all about the Cloud. Sales of Microsoft’s Azure cloud system increased by 90%. Without getting too technical, Azure is a cloud system used by app developers to build and deploy their creations on Microsoft’s servers around the world. Azure is a direct competitor to Amazon’s Web Services (a.k.a. the profitable part of Amazon). After getting a late start in the cloud, Microsoft has come roaring back to amass loads of market share. Unlike Amazon, Microsoft is a Dividend Achiever with over a decade of consistent dividend increases under its belt.

Intel: In the company’s third quarter earnings release Intel CEO Brian Krzanich said the company’s product-line is “the strongest it has ever been.” He singled out markets like artificial intelligence and autonomous driving as places Intel is focused on innovating. Intel is building a new chip called Nervana to supply the booming demand for artificial intelligence technology. The Nervana is a neural network processor (NNP), and Intel has been developing it for over three years. Naveen Rao, who began the Nervana project before it was acquired by Intel said of the work the chips will do “Machine Learning and Deep Learning are quickly emerging as the most important computational workloads of our time.” Existing hardware just won’t cut it under these new demands. Rao continues “We designed the Intel Nervana NNP to free us from the limitations imposed by existing hardware, which wasn’t explicitly designed for AI.”

Filed Under: Dow Bull and Bear Updates

Bull and Bear Portfolio Update 10.13.2017

October 13, 2017 By Richard Young

Model Guidance: No Changes for the Week

My short-term Bull & Bear Portfolio consists of 9 equally-weighted long positions and 3 equally-weighted short positions. Both the long and short stocks are selected from the Dow Jones Industrial Average. If the Dow advances over the period in which my 12-Dow stock portfolio is open, the model will make money with the stocks that advance and will lose money with the stocks that decline. And the opposite will prevail for the short stocks. Each week, I will review the model portfolio for potential changes. If no changes are required, I’ll simply post no changes for the week. You can read more about my Bull & Bear Portfolio here.

Symbol Description L / S Initial Investment Starting Price Qty L/S Prior Day Close Current Price Current Value % Chg. Day % Chg. Inception
AAPL US Apple Inc Long 10,000.00 165.70 60.34 187.00 187.00 11,283.49 0.00 12.83
CSCO US Cisco Systems Inc Long 10,000.00 44.10 226.81 43.50 43.50 9,857.11 0.00 -1.43
HD US Home Depot Inc Long 10,000.00 177.00 56.49 185.30 185.30 10,470.03 0.00 4.70
INTC US Intel Corp Long 10,000.00 51.50 194.06 54.80 54.20 10,523.97 -1.06 5.24
JPM US Jpmorgan Chase & Co Long 10,000.00 111.50 89.71 113.00 113.00 10,133.67 0.00 1.34
TRV US Travelers Cos Inc/The Long 10,000.00 136.80 73.08 130.70 130.70 9,552.76 0.00 -4.47
UNH US Unitedhealth Group Inc Long 10,000.00 235.10 42.54 243.00 243.00 10,336.08 0.00 3.36
UTX US United Technologies Corp Long 10,000.00 123.10 81.25 124.60 124.60 10,124.31 0.00 1.24
WMT US Walmart Inc Long 10,000.00 87.00 114.97 84.50 84.20 9,683.84 -0.31 -3.16
VZ US Verizon Communications Inc Long 10,000.00 47.90 208.77 47.90 47.90 9,989.56 0.00 -0.10
KO US Coca-Cola Co/The Short -8,000.00 43.70 -182.90 42.30 42.30 -7,736.63 0.00 3.40
CVX US Chevron Corp Short -8,000.00 122.30 -65.41 129.50 129.50 -8,467.66 0.00 -5.52
DWDP US Dowdupont Inc Short -8,000.00 66.04 -121.14 68.16 68.16 -8,256.81 0.00 -3.11
MRK US Merck & Co. Inc. Short -8,000.00 58.83 -135.99 59.07 59.07 -8,032.64 0.00 -0.41
IBM US Intl Business Machines Corp Short -8,000.00 144.90 -55.21 144.50 144.50 -7,977.92 0.00 0.28
Longs 100,000.00 101,955.00 -0.14 1.95
Shorts -40,000.00 -40,471.66 0.00 -1.17

Featured Company: 3M (NYSE:MMM)

Back in 1902, five men came together to found the Minnesota Mining and Manufacturing Company. Their target that day was corundum, an extremely hard mineral that can be used as an abrasive. Their first mining operation, called Crystal Bay, didn’t turn out very well. The men however endured the failure and continued on, developing other products and materials to sell.

In 1907 a man named William McKnight would join Minnesota Mining and Manufacturing Co. (later known as 3M) as an assistant bookkeeper. No one knew then that McKnight would change the company and its culture forever. The assistant bookeeper quickly rose through the ranks, ultimately becoming 3M’s chairman of the board in 1949. McKnight would firmly establish the core philosophy of innovation and collaboration at 3M.

Innovation has been at the heart of the 3M’s business model since the very beginning. Along the way the company would make a number of product breakthroughs; developing masking tape, the first waterproof sandpaper, the Thermo-Fax copying process, Scotch-Brite Cleaning Pads, Scotchgard Fabric Protector, videotape, and innumerable other new products and processes for making people’s lives easier. Today there are over 60,000 products from 3M in homes, businesses, schools and hospitals around the world.

3M isn’t satisfied to sit on its accomplishments of the past. The company is innovating for the future. Today 3M scientists are developing new nanomaterials for dental work, polarizing films to protect smartphone screens, and hundreds of other technologies to make lives easier.

3M has paid a dividend every year since 1916 and increased its dividend every year for over half a century. Today the shares yield 2.2% and I am looking for dividend growth of almost 6% in 2017.

Filed Under: Dow Bull and Bear Updates

Bull and Bear Portfolio Update: 9.29.17

September 29, 2017 By Richard Young

Model Guidance: No Changes for the Week

My short-term Bull & Bear Portfolio consists of 9 equally-weighted long positions and 3 equally-weighted short positions. Both the long and short stocks are selected from the Dow Jones Industrial Average. If the Dow advances over the period in which my 12-Dow stock portfolio is open, the model will make money with the stocks that advance and will lose money with the stocks that decline. And the opposite will prevail for the short stocks. Each week, I will review the model portfolio for potential changes. If no changes are required, I’ll simply post no changes for the week. You can read more about my Bull & Bear Portfolio here.

Click to enlarge.

Featured Company: Microsoft (NASDAQ: MSFT)

Back in 1975 two young men, Bill Gates and Paul Allen, founded a company they named Mircosoft. That year the two made their first sale to MITS Computer. The company purchased a PC programming language called BASIC. In 1981 Microsoft was incorporated, and IBM adopted its 16-bit operating system for its first personal computer. In 1985 Microsoft would introduce Windows 1.0. The operating system was the first in a family of operating systems that would expand in usage across most of the computers in the world. In 1990 Microsoft became the first PC software firm to generate over $1 billion in sales in a single year.

In tandem with its ubiquitous operating system, Microsoft has developed and acquired a number of software programs that have come to be known collectively as Office. The Microsoft Office Suite of programs, including Word, Excel, PowerPoint and others, is found on almost every computer used for real work. Office has been a powerhouse performer for Microsoft. When misadventures like the Zune mp3 player let shareholders down, Office held steady.

Now Microsoft is integrating Office into its next big endeavor, the Cloud. Microsoft’s cloud systems, led by its Azure application platform, is one of the fastest growing parts of the company. The cloud is the future, and Microsoft is a leader. With more companies adopting cloud services to increase their efficiency and redundancy, Microsoft is once again sitting at the leading edge of a technological plate shifting. Unlike many other tech companies though, Microsoft has developed a strong dividend record. MSFT shares have paid dividends since 2003, and have increased them each year for the last 12 years. Over the last five years dividends have grown at an annualized rate of 14.3%.

Filed Under: Dow Bull and Bear Updates

Bull and Bear Portfolio Update: 9.22.17

September 22, 2017 By Richard Young

Model Guidance: No Changes for the Week

My short-term Bull & Bear Portfolio consists of 9 equally-weighted long positions and 3 equally-weighted short positions. Both the long and short stocks are selected from the Dow Jones Industrial Average. If the Dow advances over the period in which my 12-Dow stock portfolio is open, the model will make money with the stocks that advance and will lose money with the stocks that decline. And the opposite will prevail for the short stocks. Each week, I will review the model portfolio for potential changes. If no changes are required, I’ll simply post no changes for the week. You can read more about my Bull & Bear Portfolio here.

Featured Company: Visa Inc., (NYSE: V)

In 1958 Bank of America launched the first consumer credit card for middle-class Americans and small to medium-sized merchants. The business grew rapidly, going international in 1974 and adding a debit card in 1975. In 1976 the Bank Americard became Visa. In 1995 Visa co-created EMV which allowed interoperability between all chip-enabled cards and terminals. In 2001 Visa surpassed 1 billion cards issued. In 2007, a restructuring of Visa’s global network was begun, creating Visa Inc. In 2008 Visa went public on the New York Stock Exchange.

Today Visa operates the world’s largest consumer-payment system, with nearly 2.5 billion credit and other payment cards in circulation across more than 200 countries. Visa is the #1 player in the electronic payments industry, with a market share of nearly 60%. Visa connects and clears transactions between banks and merchants. The company’s vast network creates high barriers to entry and a durable competitive advantage.

Visa sports a dividend yield of only 0.66%, but the company is a dividend growth powerhouse. Over the last five years, Visa has compounded its dividend at a rate of almost 26%. Not surprisingly, the total return on Visa shares over the same period is also 26%.

Visa’s growth is closely tied to that of the global economy, but the company also benefits from the ongoing transition to electronic payments. Cash still accounts for 85% of the world’s transactions and 40% of transactions in the United States. The shift to electronic payments has a long way to go. That means more potential market share for Visa to gain as it expands its business further around the globe.

Filed Under: Dow Bull and Bear Updates

Dick Young’s Short Term Bull & Bear Portfolio (STBB)

September 18, 2017 By Richard Young

One Man’s Opinion

Let’s see if STBB is for you.

You’re basically bullish on the stock market, and you have a nice chunk of cash handy that you hate to see withering away in your bank, earning squat.

You are going out of the country on an extended business trip, and you have no time to futz with your portfolio. Well, you and I are in the same boat. So I decided to share my most recent STBB short-term portfolio concept with followers to my reinvigorated Young’s World Money Forecast, first launched in 1978. Young’s World Money Forecast never died. It simply went on a 40-year vacation.

YWMF and I are now back at it. My goal is to encourage serious investors to start thinking carefully about their money and who they can work with over the next couple of decades to steer the family financial ship of state. YWMF is the perfect medium for me to share with you what I think is going on in the world. My opinions are just that, so do your homework and make your own conclusions. I am pleased to be able to offer advice during your learning process, but at the end of the day, you need to be your own boss.

As head of global investment strategy for RIA Richard C. Young & Co. Ltd., I hope you will give the name Dick Young some worthy consideration in the years ahead.

OK then, we are off and running.

My guiding principle is to include only stocks from the Dow Jones Industrial Average. Why? Because it’s like I am a DJIA insider. I’ve been in this business since what feels like the day ol’ Charles Dow thought this Dow thing up. Slightly kidding, of course, but you get the picture.

Here’s the basic deal. YWMF is all about the Dow—dedicated, you might say, to the Dow. I do not advise buying non-dividend-paying stocks to our clients, ever.

Did you know that every stock in the Dow pays a dividend? Or that long-term dividend-paying stocks offer better and more consistent returns than non-dividend-paying stocks? Serious investors, like I presume you are, simply sleep better, take less risk, and generally avoid the neck-snapping bear market volatility that is the bedmate of non-dividend-paying portfolios. No thanks to non-dividend-paying stocks, not tomorrow, not ever. We are long-term dividend and compounding disciples.

To reemphasize: My STBB portfolio includes only Dow dividend payers. I have followed the Dow, along with the leading and coincident economic indicators, for nearly five decades. I examine the monthly economic indicators under a figurative microscope to tenths of one percent. Back in the really old days, I forecasted both the leaders and the coincidents down to tenths of one percent each month. As you can see, my association with the Dow and the economic indicators is long and intense.

I emphasize my cutting-edge research with the economic indicators because you, as an investor with a high investment acuity and a long track record of success, are perfectly cognizant of the direct hand-and-glove association between the economy and the stock market. Trust me, as the stock market goes, so goes the Dow, but with far less bone-crunching volatility and much improved results thanks to dividend cash flow.

So what’s the play?

My complete playing field will include Dow stocks—longs/shorts.

If the Dow advances over the period in which my long/short Dow stock portfolio is open, the model will make money with the stocks that advance and will lose money with the stocks that decline. And the opposite will prevail for the short stocks.

If instead the Dow declines? My model will take profits in the shorted Dow stocks, and stay with the long Dow stocks until they recover and show a profit. Each of these stocks is a dividend-paying blue chip likely to increase its dividend in the year ahead. Based strictly on investing criteria, there is not a reason or a rush to sell the long positions.

In the end, everything equal, a pleasing experience in a low-risk environment figures to be the outcome.

Each week, I will review the model portfolio for potential changes. If no changes are required, I’ll simply post No Changes for the week. At some point I’ll close out the model portfolio, which I will note promptly on my new STBB strategy site page. No two-week delay as there is with the snail-mail print newsletter era. We are now in the digital age. And you will have me on your side every day of every week. I am spending full time researching for our family investment firm’s clients and spending no time producing intelligence for the masses.

Debbie and I are off to Paris/Burgundy. Make it a good week.

Warm regards,

Richard C. Young

Filed Under: Dow Stocks Tagged With: Dow Bull Bear

These 9 Dow Stocks are Offering You a Bribe, Take It

September 13, 2017 By Richard Young

There are 9 Dow stocks currently paying 3% or more. (See which stocks I’m talking about in my new “Dow Lab“) Not one of these top 2017 cash flow winners for shareholders is in the top 12 Dow stock price performers for the year.

What we are looking at in 2017 is a “follow the leader” momentum based market move completely untethered from the long term anchor of dependable cash flow for shareholders.

I cannot think of a more dangerous signal for serious money.

As of Sept 2017, all investors should be concentrating on companies that bribe today’s stockholders with a yield of more than 3% and the promise of a higher dividend in 2017 than in 2016.

Filed Under: Dividends

Dividends are Vital. The Reason Why Is Compound Interest

September 8, 2017 By Richard Young

Why are dividends important? Because they allow the power of compound interest to work for you. I was speaking with a client yesterday who is in the process of helping his children establish Roth IRAs. I told him it’s amazing how just getting in the game can do wonders for one’s financial well-being: Imagine what this will look like in 50-years. Remember, just the process of starting an investment puts you or a loved one light years ahead of those bogged down and doing nothing at all.

Take a look below at the power of compound interest. An investor who makes eight annual contributions starting at age 25 and then makes no more will end up at age 64 with $227,390 at an assumed growth rate of 9%. Meanwhile, another investor who skips those eight contributions early in life and begins investing later at 33 and makes annual contributions each year until age 64 will end up with only $214,560 that year (assuming the same 9% growth rate). That’s the power of compounding.


Originally posted March 24, 2017.

Filed Under: Dividends, Dividends & Compounding, Miracle of Compounding Tagged With: Compound Interest

Investors Tarred and Feathered

August 29, 2017 By Richard Young


The beginning of a long-term trend away from high-management-fee hedge funds, mutual funds and packaged product hawkers is picking up steam. For decades, individual investors have taken the bait from the high fee speculators and misallocators. Investors now appear to have awakened to the many-decade fleecing. Here, Market Watch highlights a fistful of troubling reminders of the ever-growing carnage.

  • Last year, hedge funds shut down at a pace last seen in 2008.
  • For the full year, a total of 1,057 funds were closed, topping the 1,023 liquidations seen in 2009.
  • Hedge fund liquidations in 2016 surpassed the post-financial crisis peak.
  • Average hedge-fund management fees fell to 1.48% in the fourth quarter from 1.49% in the previous three months.
  • The average incentive fee for new funds declined to 17.71% from 17.75% in 2015.
  • In 2016, the asset-weighted hedge-fund index returned 2.86%.
  • The S&P 500, with dividends, gained 11.93%.

Benefactors of this bloodletting will be modest-sized, old-line, traditional investment council firms. These tight-knit client friendly and fee friendly firms harken back to a more civil time, when the best interests of a client topped the list of concerns in long-time family relationships. Preservation of capital and modest and consistent total returns were the order of the day. A steady flow of cash in the form of dividends and interest allowed relaxed clients to sleep well at night knowing that at all times their family advisor’s interests were meticulously aligned with their own. That’s just the way things were expected to be.

Today? Well you observe the results above.

Filed Under: Dividends, Dividends & Compounding Tagged With: Hedge Funds, Investing

Lower Portfolio Risk to Boost Return

August 4, 2017 By Richard Young

Image Credit: © Tierney – Adobestock.com


UPDATE: The words I wrote in this post from August 27, 2010 are as sound today as they were back then. The basic principles of good investing just never change. This is how we operate at Richard C. Young & Co., Ltd. 

Do you know the difference between total return and investor return? Most investors are familiar with the concept of total return. The total return of a fund is simply the sum of the capital and income return of a fund over a certain holding period. The total return of a fund of course assumes a buy-and-hold strategy.

Investor return (a Morningstar term) is a measure of the experience of the average investor in a fund. Investor return does not assume a buy-and-hold approach. Instead it accounts for all cash flows into and out of the fund in an attempt to measure how the average investor in the fund performed over time.

Investor return is not a replacement for total return, but an important complement. Total return indicates how a fund manager performed over a certain time period, but investor return shows how the average investor in a fund performed.

Hot funds with strong recent performance often show total returns that are higher than investor return, as do volatile funds. One of the reasons investor return in volatile funds can lag total return is that investors pile into funds when they are in an uptrend, but bail out after performance turns south. You end up with a situation where there are more assets in a fund when returns are poor than when they are strong. That lowers investor return.

The formerly overhyped Legg Mason Value Trust Fund offers a telling illustration of this concept. For those of you who are not familiar with it, this is Bill Miller’s fund. Prior to a recent streak of poor performance that began in 2006, Mr. Miller’s fund was touted by the financial press as being the only mutual fund to outperform the S&P 500 for 15 consecutive years. Let’s first look at the total return of the fund. For the 15-year period ending July 31, 2010, the Legg Mason Value Trust Fund earned a compound annual total return of 6.87%, compared to a return of 6.48% for the S&P 500. That’s not bad; even after some atrocious relative performance in 2006, 2007, and 2008, Mr. Miller managed to outperform the index by a few basis points. But how did the average investor in his fund do? The 15-year investor return for the Legg Mason Value Trust Fund was only 4.40%—a significant difference of 2.47% per year.

Compare the experience of the Legg Mason fund to a balanced fund such as Vanguard Wellesley Income. Over the last 15 years, the compound annual total return of the conservative Wellesley Income Fund was 8.1%, and the investor return was 7.73%, a difference of only 0.57%. Wellesley’s investor return was closer to the total return because investors in the fund didn’t bail out when markets were down. Wellesley’s low volatility provided investors with comfort and confidence to hold their shares. In my forty-plus years in the investment business, I have found that during down markets, investors are less likely to bail out of funds with modest volatility than those with high volatility. Bailing out of your funds during down markets is a sure way to destroy wealth. The better strategy is to increase your comfort level by lowering your portfolio’s risk. Chances are you’ll end up boosting your return.

Filed Under: Dividends, Dividends & Compounding Tagged With: Dividends, Portfolio Risk

The Power of a Compound Interest Table

May 12, 2017 By Richard Young


Compound interest was described as the greatest mathematical discovery of all time by Albert Einstein. Compound interest “Tis the stone that will turn all of your lead into gold,” according to Benjamin Franklin. The late great Richard Russell explained compound interest as the royal road to riches. Below I’ll explain this powerful investment tool and show you how to read a compound interest table.

Compound interest is the heart and soul of investing. Investors lacking a solid grounding in compounding are more likely to suffer from a wandering eye. They can be inclined to favor Hail Mary tactics in their investment portfolios, where the goal of every buy is score big and fast (think options and cash burning startups). The downsides of such an approach are 1.) it rarely works and 2.) loads of volatility. In contrast, investors who truly understand and appreciate the awesome power of compound interest recognize that the combination of time and modest return is a better path to investment prosperity.

Compound Interest Table Still Best

It may surprise you, but in an industry with massive computing power, where algorithmic trading and quantitative models are now prolific, the best way to truly master the awesome power of compounding is still to study an old fashioned compound interest table.

A compound interest table gives you a sense of just how powerful compounding can be at varying rates of return and over varying time horizons. Sure, you can use a calculator or an Excel spreadsheet to find the future value of an investment, but that single data point doesn’t do compound interest justice. Studying the array of compounding factors and how they increase with respect to time and rate of return leaves an indelible mark on one’s mind.

To emphasize the power of compounding, we have included a compound interest table below.

Reading a Compound Interest Table

Move down each column on the compound interest table to see the effect of time on the multiplier. Move across each row on the compound interest table to see the effects of changing the rate of return. Take a look at the row that starts with the 20-year time-horizon. Now move across to the 5% annual rate of return column. Note the compounding factor of 2.65. If you invested $10,000 at a 5% interest rate for 20 years you would have $26,500.

Now staying in the same row, move across to the 10% return column and note the compounding factor of 6.73. That same $10,000 at a 10% compounded annual return would be worth $67,300 after 20 years. The return doubled, but your ending wealth more than doubled. Now double the return again. At a 20% annual rate of return $10,000 then becomes a whopping $383,400 after 20 years. The returned doubled again, but you’re your ending wealth would have increased by a factor of almost 6!

That is profound! And that is the awesome power of compound interest.

For an expanded printer-friendly version of our compound interest table that can be handed out to the kids and/or grand kids click here for a compound interest table.

Compound Interest Table

Future Value of $1 at the end of n periods: FVIF k,i = (1+i) n where n= number of periods, i = rate of return

wdt_ID Period 5% 7% 10% 16% 20%
1 1 1.0500 1.0700 1.1000 1.1600 1.2000
2 2 1.1000 1.1400 1.2100 1.3500 1.4400
3 3 1.1600 1.2300 1.3300 1.5600 1.7300
4 4 1.2200 1.3100 1.4600 1.8100 2.0700
5 5 1.2800 1.4000 1.6100 2.1000 2.4900
6 6 1.3400 1.5000 1.7700 2.4400 2.9900
7 7 1.4100 1.6100 1.9500 2.8300 3.5800
8 8 1.4800 1.7200 2.1400 3.2800 4.3000
9 9 1.5500 1.8400 2.3600 3.8000 5.1600
10 10 1.6300 1.9700 2.5900 4.4100 6.1900

Filed Under: Miracle of Compounding Tagged With: Compound Interest

  • « Previous Page
  • 1
  • …
  • 24
  • 25
  • 26
  • 27
  • 28
  • Next Page »

Compensation was paid to utilize rankings. Click here to read full disclosure.

RSS New From Young Research & Publishing

  • May RAGE Gauge: Survive
  • US May Ease Global AI Chip Export Limits
  • Energy Dominance: DOE Outlines FY2026 Budget Under Trump Directive
  • Manufacturing Shines Amid Broader U.S. Productivity Decline
  • Ghost Ships on Radar: China’s New Tech Mimics Entire Navy Fleets
  • “Investors Need to Beat Back This Mighty Foe,” Dick Young
  • China Cuts Rates to Offset U.S. Tariffs Ahead of Trade Talks
  • Trump Administration Pauses Fossil Fuel Limits on Federal Buildings
  • Amazon Unleashes Vulcan: A Robot That Feels
  • HELP: I’m Caught in the Tariff Crossfire, Part 2

RSS New From Your Survival Guy

  • May RAGE Gauge: Survive
  • Investing Mistakes to Avoid: #2 Tomorrowland
  • “Investors Need to Beat Back This Mighty Foe,” Dick Young
  • Why the Push for Low Rates?
  • Investing Mistakes to Avoid: #3 Back 40 Back
  • Can China and the BRICS Defeat the Dollar?
  • Why Is Harvard Crying?
  • The Magic of Warren Buffett
  • Sell In May?
  • Investing Mistakes to Avoid: #4 Mr. Happy Yappy

Search Our Site

Richard C. Young & Co., Ltd.

–Client Letter Sign Up–

Sign up to receive email alerts when our latest client letter is posted on our website.

Copyright © 2025 · About Dick Young · Terms & Conditions


Loading Comments...
 

    Are you sure?

    Please confirm deletion. There is no undo!