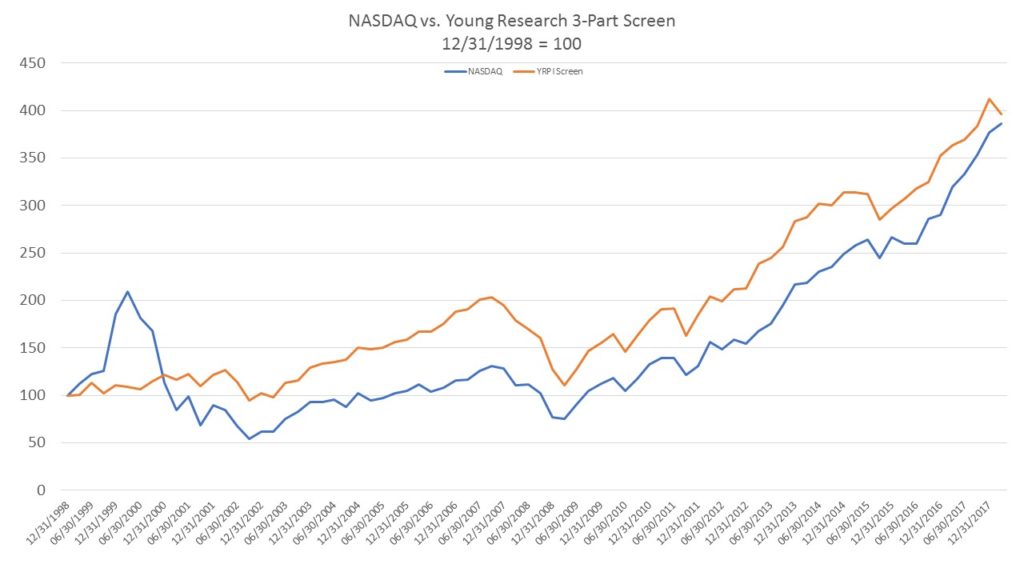
Near the end of 1993, Debbie and I were hunkered down at The Dorset Inn in Vermont. Its wide pine board floors, restored tap room, gourmet dining room and antique-outfitted guest rooms make the small inn a special place to get away from the constant din of markets and politics. The events of that fall were oddly connected to this very moment in American history.
In November of that year President Bill Clinton told the world that North Korea must never be allowed to develop a nuclear weapon. And in December, Clinton signed NAFTA into law. Projections made in 1993 on how the Korean situation and NAFTA would turn out look poor in hindsight. Attempting to divine the future is a fool’s game, and as I wrote back then, in investing you must “invest in what you know to be true today, not in what you think will be true tomorrow.”
I wanted you to focus then on the value of putting the odds on your side, and I still do. I wrote:
OK, given that there is a lot of similarity among long-term results and that different styles of investing, as well as managers, come in and out of style, what’s the best strategy for successful mutual fund investing? How can you be a consistent winner with confidence?
At the top, invest in what you know to be true today, not in what you think will be true tomorrow. Insist on putting the odds on your side. Take full advantage of the tools of the mathematician. For example, here’s a little mathematical shortcut you can use to determine compound interest. How long does it take for money to double at a predetermined rate of interest? Use the Rule of 72. Simply divide the rate in question into 72. If your interest rate is 9%, money will double in eight years (72 ÷ 9 = 8). That’s all there is to it. Compound interest should be your most trusted investor ally (aside from Dick Young, of course), and the Rule of 72 can help you understand the value of compound interest.
Putting the odds on your side—such as understanding the power of compound interest—will make you a winner. That is most certainly your first rule for successful long-term investing.
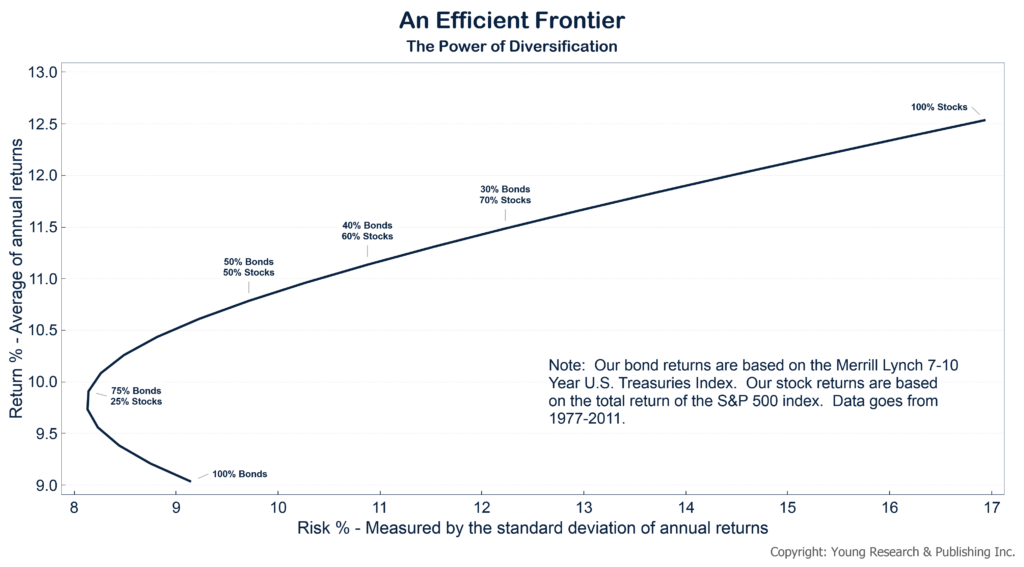
Don’t let unsure expectations of what will happen in the future cloud your investing judgement. You must instead seek to minimize risk, investing in dependable streams of income, and harden your portfolio against uncertainty.