In the late 1990s, I offered my readers a simple three-part screen to make the job of core common stock selection easy and comfortable. It reduced the field of play to what one might call investment-grade common stock issues.
What was the screen? I advised investors to stick with NYSE listed dividend paying stocks trading at less than 3X revenue. When I introduced the screen in 1998, it winnowed the common stock investment universe down to a few hundred issues from an unwildy 7,500+ at the time.
There was still much work to be done to craft a final investment portfolio, but the screen did a nice job of helping investors fish in the lakes stocked with trout and bass and avoid the ones where carp was the dominant species.
I explained the screen to readers as follows:
Rule #1: Stay on the NYSE. You have probably noticed that NASDAQ sotcks can be especially volatile. Most NASDAQ stocks are smaller and less seasoned than their NYSE brethren. Just the other day, computer component supplier Adaptec reported quarterly earnings below Street predictions, and traders hammered the rather thinly traded shares down 40% in a single session. A 40% haircut in one day is volatility beyond what I’m sure you find comfortable.
One way to reduce this volatility is to buy only NYSE stocks for your CORE portfolio. Don’t venture over to the NASDAQ. Yes, I know many fine companies trade on the NASDAQ, but a set of hard-and-fast rules is the tonic you need to stay out of trouble, and hard and fast means some compromising.
Rule #2: Invest only in dividend-paying stocks. By simply eliminating the non-diviend payers, you dump a huge hunk of the speculative stock universe and greatly reduce your field of eligible NYSE candidates for your CORE list.
Rule #3: Pay no more than three times annual revenues. Here, you are relating a given stock’s market cap (price X number of shares outstanding) to annual revenues.
How has the investment-grade common stock universe I described in 1998 performed since? The chart below compares the performance of this exact screen run every quarter from year-end 1998 through March of this year, to the performance of the NASDAQ Composite.
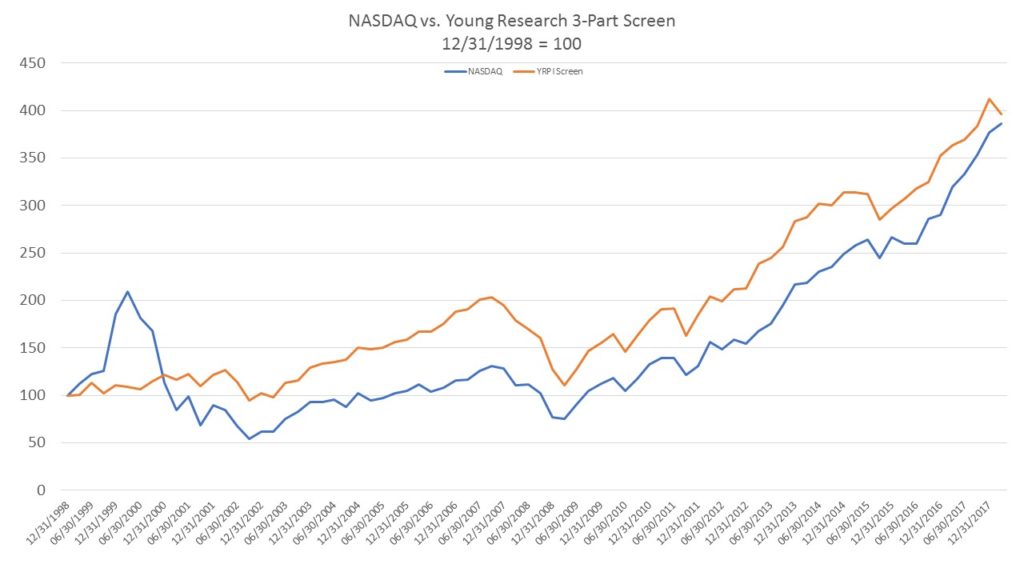
Both the screen and the NASDAQ are capitalization weighted. As you can see, the screen performed slightly better than the NASDAQ, but most importantly, it did so with only about 60% of the risk of the NASDAQ.
The structure of the stock market has changed a lot over the last 20 years and an NYSE listing is much less meaningful today than it was in 1998, but the concept of sticking with quality dividend payers at reasonable prices remains my advised approach for eliminating a huge chunk of the speculative stock universe.
Issues included in that speculative universe that are widely held among mutual funds and ETFs you may own include Facebook, Amazon, Netflix, and Google (here I eliminate the NYSE listing criteria). Not one pays a dividend, and all four trade at more than 3X revenues. You may argue all four are good companies that dominante their space. That may be true, but it was also true of Microsoft, Intel, and Cisco in 1998 (none passed my screen at the time). Ten years later, all three were down and down more than the S&P 500.
Two decades and a couple of ghastly bear markets later, the same focus on quality, dividends, and value remains essential to your long-term investment success no matter how dominant you may believe today’s social media giants have become.