I have written in the past that politics can have a great effect on market performance. Today America is enduring one of the most contentious political climates in memory, and at the same time the stock market has become volatile.
The best year in the four-year presidential election cycle is the year before the election. In this cycle that’s 2019. Since 1875, the average performance of the S&P 500 in the calendar year before a presidential election has been 14.3%. The presidential election year itself comes in next with an average of 10.9%, and midterm election years and the year after the presidential election produced averages of 9% and 8.9% respectively.
So does that mean a roaring bull market is guaranteed in 2019? Of course not, there are no promises, no tricks, and no shortcuts in investing.
I wrote this back in 2006 (charts have been updated to reflect the subsequent years):
Politics & Stock Prices from 1959 On
The stock market likes good times. Until just recently in 2005, most investors (not you, I trust) have not had much about which to cheer. Much of the trauma this year has related to the foul media coverage President Bush has received regarding Hurricane Katrina and the Iraq war. Just how much does the political landscape affect stock prices? A whole lot. In fact, few variables rate higher on my list of stock market influences. To make my point, I have put together four historical displays starting with the year I got started with the stock market—1959. The displays depict stock market gains and losses in each of the four years of the presidential cycle.
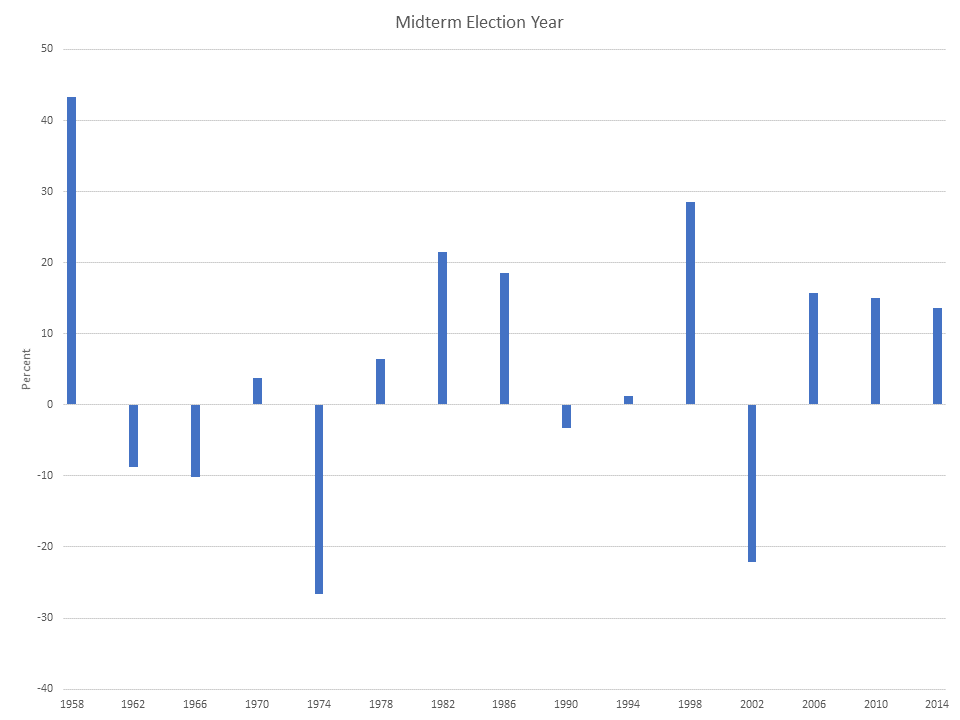
Display #1—Election-Year Power
Anyone who tells you to pay no attention to politics as it relates to the stock market is smoking something funny. Politicians of all stripes will say just about anything to get elected, and the vote-getting bribery of politics provides a good-time feeling in almost every election year. Since 1959, a presidential election year has brought with it higher stock prices in 10 of 12 years.
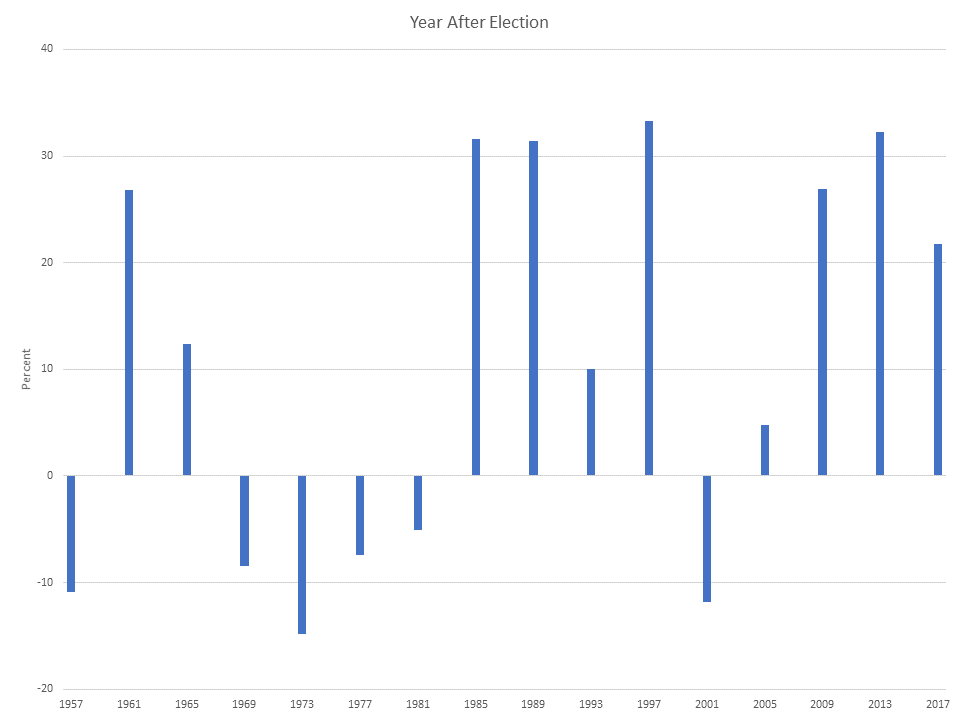
Display #2—The Year After a Presidential Election
The rubber hits the road as the incoming president attempts to back up all those over-the-top campaign promises. The results are often short of the mark, and the stock market has an in-and-out time of it. The stock market results in 2005—an after-election year—have been pretty predictable.
Display #3—Two Years After a Presidential Election
This is also an in-and-out year, as electioneering is not front and center. Furthermore, tough and often unwelcome presidential decisions must be made.
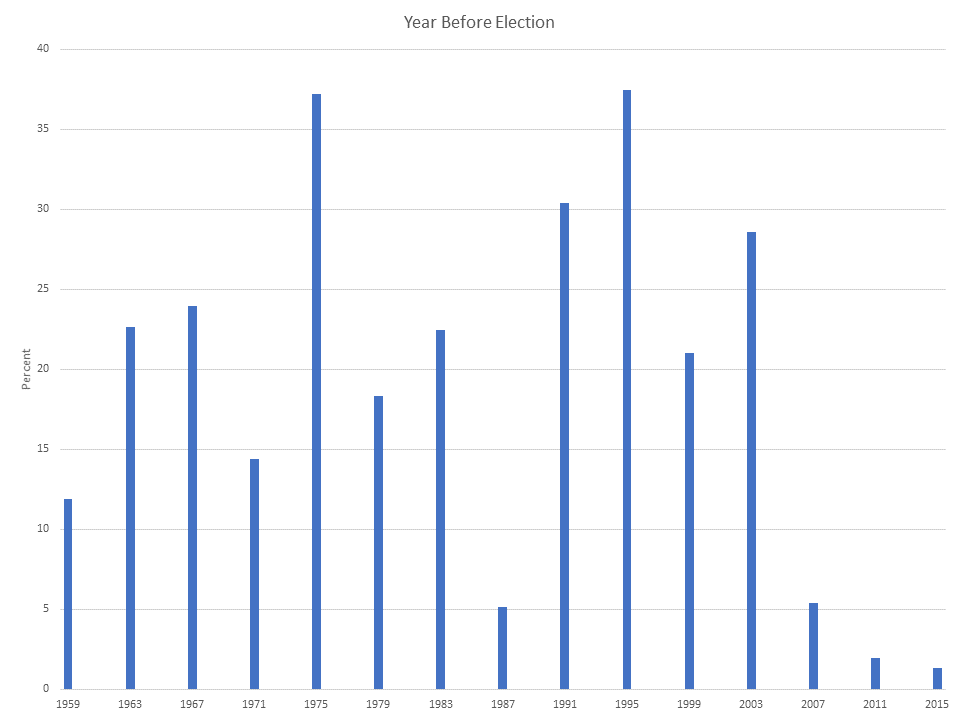
Display #4—The Year Before a Presidential Election
Since the banner year of 1959, there has not been a single stock market downer in the year leading up to a presidential election. Furthermore, stocks make big gains more so than in any other year in the presidential election cycle. Since 1959, you get a 22-and-2 record of ups and downs when you pair the year before a presidential election with the election year. By contrast, pairing the two years following a presidential election gives you a not-so-hot 11-and-11 record.
Looking Ahead and Cringing
In terms of the presidential election cycle, next year has the lowest odds of success of any of the four years in the cycle. Worse yet, the year coming up, 2006 (two years following the presidential election), has the fewest number of big years.